What is Support and Resistance in Forex Market?
Support: the horizontal area on your charts where potential buying pressure could come in and push the price higher.
Resistance: the horizontal area on your charts where selling pressure could come in and push the price lower.- Zoom your charts out so they show at least 300 candles.
- Draw the most obvious levels (if you need to second guess yourself, it probably isn’t worth drawing).
- Adjust the levels to get as many “touches” as possible.
Support and Resistance are two ways to analyze market
trends. Support is when prices stop falling and start rising again. Resistance
is when prices stop rising and start falling again. These levels are important
because they indicate whether the current trend will continue or change
direction. Traders use these levels to determine if there is an opportunity to
buy or sell at a particular point in time. That's why Support and Resistance are important.
Does support and resistance really work?
Yes, Support and Resistance are really work in live market. When prices are falling rapidly, there is often a strong reaction from traders who are trying to buy low and sell high. These traders may try to get out of positions before the price falls further, but if they are not careful, they will end up buying at lower prices and selling at higher ones. If they are lucky, they might even get out of the market entirely. But if they are unlucky, they could lose money. When prices are rising rapidly, there is also a strong reaction from traders trying to get in on the action. Prices rise until they reach a resistance level, then stop. Traders who were waiting for the price to go back down may start to panic and sell all their shares. If they are lucky enough to get out of the market before the price rises again, they will have made a profit. However, if they are unlucky, their losses will be greater than those incurred during the previous decline.
What is the main difference between Support and Resistance?
What happens when a support is tested multiple times?
When the price re-tests support, some of these orders get filled. So the more the price re-tests support, the more orders get filled. And when all the orders get filled, who’s left to buy? No one, and that’s when the market breaks down.
Here’s what I mean:
What happens if the price breaks Support?
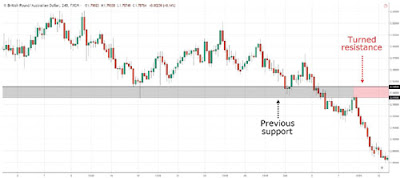
When the price breaks below support, that horizontal area could become future resistance. And when the price breaks above resistance, that horizontal area could become future Support.
Here’s what it looks like:
How to tell when Support and Resistance will break?
There’s no way to tell for sure whether support or resistance will break. But here are a few things you’ll want to pay attention to:
Resistance tends to break in an uptrend — As you know, an uptrend consists of higher highs and lows
And for it to continue, the price must break out of resistance (or swing high).
Support tends to break in a downtrend — Likewise, a downtrend consists of lower highs and lows. And for a downtrend to continue, the price must break out of support (or swing low).
Higher lows into resistance are a sign of strength — This looks something like an ascending triangle. It’s a sign of strength because it tells you buyers are willing to buy at higher prices (despite the price being near resistance).
Here’s an example:
Here’s what I mean:
Summary
- Support is a horizontal area on your chart where potential buying pressure could come in and push the price higher.
- Resistance is a horizontal area on your charts where selling pressure could come in and push the price lower.
- The more times support or resistance is tested within a short period of time, the greater the likelihood it will break.
- Observing support and resistance is one way to identify an area of value on your charts. Others include looking at the moving average, trend line, channel, etc.
- Support tends to break in a downtrend or when there are lower highs into support.
- goog_192447224Resistance tends to break in an uptrend or when there are higher lows into resistance.


